
Introduction
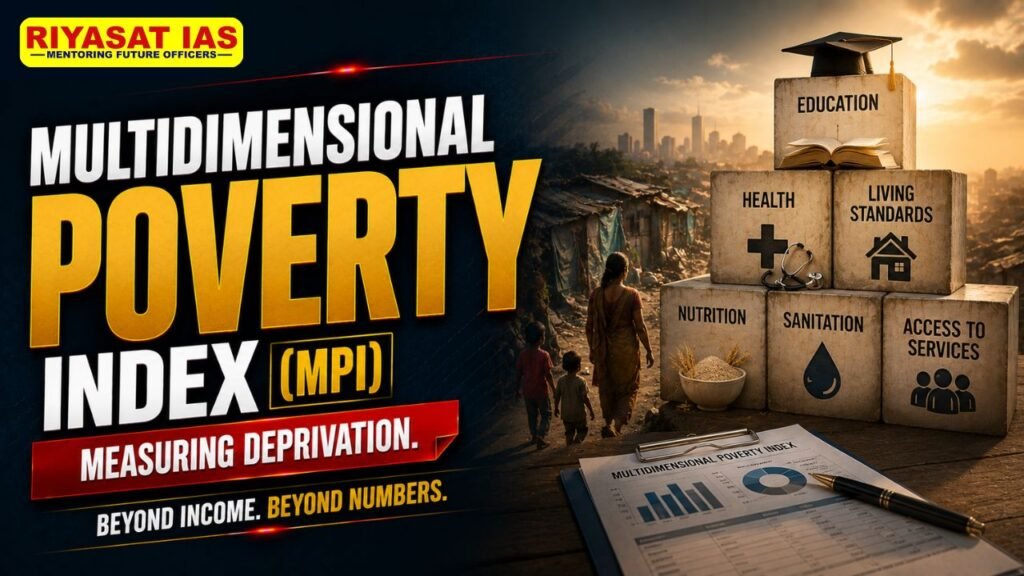
The Multidimensional Poverty Index (MPI) measures poverty beyond income by capturing the multiple deprivations people face in their daily lives. It focuses on health, education and standard of living, providing a broader understanding of poverty than income-based measures alone.
The Global MPI 2025, titled Overlapping Hardships: Poverty and Climate Hazards, adds an important dimension by examining the relationship between multidimensional poverty and climate hazards. It shows that poor populations are often more exposed to environmental risks such as extreme heat, droughts, floods and air pollution.
What is the Multidimensional Poverty Index?
- MPI Meaning: The Multidimensional Poverty Index is an international measure developed by the United Nations Development Programme (UNDP) and the Oxford Poverty and Human Development Initiative (OPHI) to identify overlapping deprivations in people’s lives.
- Beyond Income Poverty: Unlike monetary poverty measures, MPI examines whether people have adequate access to education, healthcare and basic living conditions.
- Three Dimensions: MPI measures deprivation across Health, Education and Standard of Living, with each dimension carrying one-third of the total weight.
- Poverty Cut-off: A household is considered multidimensionally poor when its weighted deprivation score is one-third or more.
- MPI Value: The MPI is calculated on a scale from 0 to 1, with a lower value indicating lower multidimensional poverty.
How Does the Multidimensional Poverty Index Measure Poverty?
1. Health
- Nutrition: A household is considered deprived if any adult or child is undernourished.
- Child Mortality: A household faces deprivation if a child under 18 has died within the specified reference period.
2. Education
- Years of Schooling: A household is deprived when no eligible member has completed at least six years of schooling.
- School Attendance: A household is deprived when a school-aged child is not attending school up to the prescribed level.
3. Standard of Living
- Cooking Fuel: Dependence on traditional fuels such as wood, charcoal, dung or coal is treated as a deprivation.
- Sanitation: A household is deprived when sanitation facilities are unimproved or shared with other households.
- Drinking Water: Deprivation exists when improved drinking water is unavailable or requires more than a 30-minute round trip to access.
- Electricity: Lack of access to electricity constitutes a deprivation.
- Housing: Poor-quality walls, roofs or floors made from natural or rudimentary materials indicate deprivation.
- Assets: Limited ownership of specified household assets, along with the absence of a qualifying vehicle, constitutes deprivation.
How is the Multidimensional Poverty Index Calculated?
- Identification of Deprivations: Households are assessed across the specified MPI indicators to identify the areas in which they experience deprivation.
- Weighted Scoring: Each indicator is assigned a specific weight, and the household receives a deprivation score based on its circumstances.
- Poverty Cut-off: A household with a weighted deprivation score of 33% or more is classified as multidimensionally poor.
- Headcount Ratio (H): Measures the proportion of people who are multidimensionally poor.
- Intensity of Poverty (A): Measures the average proportion of weighted indicators in which multidimensionally poor people experience deprivation.
- MPI Value: The final MPI is calculated using the formula MPI = H × A.
Global Multidimensional Poverty Index 2025: Key Findings
The Global MPI 2025 examines poverty and its overlap with major climate hazards across countries and regions.
- Global Multidimensional Poverty: Around 1.1 billion people out of 6.3 billion covered by the report live in acute multidimensional poverty.
- Child Poverty: More than half of multidimensionally poor people are children, highlighting the risk of intergenerational poverty.
- Middle-income Countries: Around 740 million poor people, or approximately 64.5%, live in middle-income countries.
- Climate Vulnerability: Around 887 million multidimensionally poor people are exposed to at least one major climate hazard, including extreme heat, drought, floods and air pollution.
- Multiple Climate Hazards: Around 309 million poor people face three or four climate hazards simultaneously, increasing their vulnerability.
- Basic Living Deprivations: Lack of clean cooking fuel, housing, sanitation, nutrition and electricity remains common among multidimensionally poor households.
- Poverty-Climate Link: The report highlights that climate hazards can deepen existing poverty by affecting livelihoods, food security, health and access to basic services.



India and Multidimensional Poverty
India has made significant progress in reducing multidimensional poverty, although substantial regional and social disparities remain.
- India’s MPI Value: India’s MPI value stands at 0.069 according to the figures provided.
- Headcount Ratio: India’s multidimensional poverty headcount ratio is 16.4%, meaning around 16 out of every 100 people experience multidimensional poverty according to the cited estimates.
- Intensity of Deprivation: The intensity of deprivation is around 42%, representing the average proportion of weighted indicators in which multidimensionally poor people experience deprivation.
- Poverty Reduction: Earlier MPI findings indicate that around 135 million people escaped multidimensional poverty between 2015–16 and 2019–21.
- Standard of Living Deprivation: Standard of living contributes around 39.7% of India’s multidimensional deprivation.
- Health Deprivation: Health contributes around 32.2% of multidimensional deprivation.
- Education Deprivation: Education contributes around 28.2% of multidimensional deprivation.
Regional Variation in India
- Higher Poverty States: States such as Bihar, Jharkhand, Uttar Pradesh and Madhya Pradesh continue to record higher levels of multidimensional poverty.
- Better-performing States: States such as Kerala, Tamil Nadu and Goa perform better, supported by stronger educational and social-development outcomes.
- Regional Disparities: Differences between states show that national progress in poverty reduction can coexist with significant variations in access to education, healthcare and basic living conditions.
Kerala’s Extreme Poverty Eradication Programme
- Programme Launch: Kerala launched its Extreme Poverty Eradication Programme in 2021 to identify and support extremely poor families.
- Identification of Families: Around 64,006 extremely poor families were identified through detailed assessments covering food, health, livelihood and shelter.
- Family-specific Micro-plans: Individual plans were prepared to address household-specific requirements such as housing, land, documentation and access to essential services.
- Progress: According to the provided material, 59,277 families had been successfully uplifted by 2025.
Why is the Multidimensional Poverty Index Important?
- Captures Multiple Deprivations: MPI identifies disadvantages in health, education and living standards that income-based poverty measures may overlook.
- Improves Policy Targeting: Indicator-level information helps governments identify the specific forms of deprivation faced by households.
- Measures Human Development: MPI connects poverty with access to essential services and basic human capabilities.
- Highlights Regional Gaps: State- and region-level data can reveal differences in poverty and help governments design targeted interventions.
- Links Poverty with Climate Risk: The 2025 MPI demonstrates how environmental hazards can intensify existing socioeconomic vulnerabilities.
- Supports Inclusive Growth: Reducing multidimensional poverty requires improvements in income, health, education, housing and access to basic services.
Major Challenges in Reducing Multidimensional Poverty
- Climate-Poverty Nexus: Extreme heat, droughts and floods can damage livelihoods, reduce food security and worsen health outcomes among vulnerable households.
- Unequal Access to Resources: Rural and disadvantaged communities continue to face gaps in sanitation, clean water, electricity and other essential services.
- Child Poverty: The large share of children among the multidimensionally poor makes nutrition, education and healthcare crucial for breaking intergenerational poverty.
- Data Gaps: Irregular and inadequate household-level data can make it difficult to accurately identify vulnerable populations and track poverty reduction.
- Policy Fragmentation: Poverty, education, health, infrastructure and climate policies often operate separately despite their interconnected nature.
- Regional Disparities: Differences in infrastructure, human capital and access to public services continue to produce significant variations in multidimensional poverty across regions.
Way Forward
- Integrate Poverty and Climate Policies: Poverty reduction programmes should be combined with climate adaptation and disaster-resilience measures to protect vulnerable households from environmental shocks.
- Strengthen Human Capital: Greater investment in education, nutrition, healthcare and skill development can help households break the intergenerational cycle of poverty.
- Improve Basic Services: Universal access to clean water, sanitation, electricity, housing, healthcare and clean cooking fuel should remain central to poverty reduction.
- Target Vulnerable Groups: Policies should prioritise children, women, rural communities and climate-vulnerable households facing multiple deprivations.
- Strengthen Local Participation: Community participation and decentralised planning can improve beneficiary identification, implementation and accountability.
- Improve Data Systems: Regular household surveys and integrated socioeconomic data can strengthen poverty measurement, monitoring and policy targeting.
- Promote International Cooperation: Developing countries need greater access to finance, technology and technical assistance to address poverty and climate vulnerability together.
Conclusion
The Multidimensional Poverty Index provides a more comprehensive understanding of poverty by measuring the overlapping disadvantages experienced by households rather than focusing only on income.
India’s progress in reducing multidimensional poverty reflects improvements in education, health and living standards, but regional disparities and persistent basic-service gaps remain significant challenges. The Global MPI 2025 further demonstrates that climate change can amplify these vulnerabilities.
Therefore, future poverty-reduction strategies should integrate human capital development, social protection, basic services, climate resilience, local participation and data-driven governance. Such an approach can make poverty reduction more sustainable and support India’s broader goals of inclusive growth and human development.
Frequently Asked Questions (FAQs)
What is the Multidimensional Poverty Index?
The Multidimensional Poverty Index (MPI) measures poverty through multiple deprivations in health, education and standard of living, rather than income alone.
Who publishes the Global MPI?
The Global MPI is developed by the UNDP and Oxford Poverty and Human Development Initiative (OPHI).
What are the three dimensions of MPI?
The three dimensions are Health, Education and Standard of Living.
What is the MPI poverty cut-off?
A household is considered multidimensionally poor when its weighted deprivation score is 33% or more.
How is MPI calculated?
MPI is calculated as Headcount Ratio (H) × Intensity of Poverty (A).
What is India’s MPI value?
According to the figures provided, India’s MPI value is 0.069.
How many Indians escaped multidimensional poverty?
Earlier MPI findings indicate that around 135 million people escaped multidimensional poverty between 2015–16 and 2019–21.
Why is the Global MPI 2025 important?
The 2025 report is significant because it examines the relationship between multidimensional poverty and climate hazards, showing how environmental risks can deepen existing poverty.


 Ravi Raaz
 Hassan Khan
 Shadab Ali