
GDP and National Income
Gross Domestic Product (GDP) and National Income are the two most important indicators used to measure a country’s economic performance. They help governments, businesses, investors, and policymakers assess economic growth, production, income, and living standards.
GDP measures the value of all final goods and services produced within a country’s geographical boundaries during a specific period. National Income, on the other hand, measures the total income earned by the residents of a country from all economic activities.
In India, GDP and National Income estimates are compiled by the Ministry of Statistics and Programme Implementation (MoSPI) using the United Nations System of National Accounts (SNA 2008).
Why is this Topic Important?
GDP and National Income form the foundation of the Indian Economy syllabus and are frequently asked in UPSC Prelims, GS Paper III, Essay, and Interview.
The topic is directly related to:
• Economic Growth: Measures the size and performance of the economy.
• National Income Accounting: Explains different income aggregates.
• Inflation: Helps understand Real GDP and GDP Deflator.
• Fiscal and Monetary Policy: Supports policy formulation by the Government and RBI.
• Economic Survey and Budget: Forms the basis of economic analysis and policymaking.
• International Comparison: Enables comparison of India’s economy with other countries.
What is GDP?
Gross Domestic Product (GDP) is the total market value of all final goods and services produced within the geographical boundaries of a country during a specific period, usually a financial year.
It is the most widely used indicator of economic performance because it measures the size of an economy and its rate of growth. Rising GDP generally indicates higher production, investment, income, and employment.
Definition
Gross Domestic Product (GDP) is the total market value of all final goods and services produced within a country’s domestic territory during a given period.
Features of GDP
GDP captures the overall economic activity of a country.
• Measures Domestic Production: Includes all goods and services produced within the country’s geographical boundaries.
• Includes Final Goods and Services: Intermediate goods are excluded to avoid double counting.
• Based on Value Addition: Measures only the additional value created at each stage of production.
• Measured at Market Prices: Values output using prevailing market prices.
• Time-Specific: Calculated for a financial year or quarter.
• Indicator of Economic Performance: Reflects the size and growth of the economy.
Why Does GDP Measure Value Addition?
GDP follows the Value Addition Method to prevent double counting of production.
For example, wheat is converted into flour, and flour is used to make bread. If the value of wheat, flour, and bread is added separately, the same product will be counted multiple times.
Therefore, GDP records only the additional value created at each stage of production, ensuring accurate estimation of economic output.
Methods of GDP Estimation
GDP can be estimated using three internationally accepted methods. Although each method approaches GDP from a different perspective, all of them should theoretically produce the same estimate.
1. Production (Value Added) Method
This method estimates GDP by measuring the Gross Value Added (GVA) generated by different sectors of the economy.
It calculates the value added by Agriculture, Industry, and Services, and then adjusts it for taxes and subsidies.
Formula
GDP = GVA + Product Taxes − Product Subsidies
Advantages
• Measures sector-wise contribution to GDP.
• Useful for analysing structural changes in the economy.
• Widely used for estimating Gross Value Added (GVA).
2. Expenditure Method
This method estimates GDP by adding the expenditure incurred on all final goods and services produced in an economy.
Components
• Private Final Consumption Expenditure (PFCE): Household expenditure on goods and services.
• Government Final Consumption Expenditure (GFCE): Government spending on public services.
• Gross Fixed Capital Formation (GFCF): Investment in machinery, infrastructure, buildings, and other productive assets.
• Change in Inventories: Increase or decrease in unsold stock.
• Net Exports (X − M): Difference between exports and imports.
Formula
GDP = C + I + G + (X − M)
Where,
C = Consumption
I = Investment
G = Government Expenditure
X = Exports
M = Imports
3. Income Method
The Income Method estimates GDP by adding all incomes earned by the factors of production during the production process.
Components
• Compensation of Employees: Wages and salaries.
• Operating Surplus: Profits earned by businesses.
• Mixed Income: Income of self-employed individuals.
• Rent: Income earned from land and buildings.
• Interest: Income earned from capital.
Advantages
• Measures income generated from production.
• Useful for analysing factor incomes.
• Helps estimate various National Income aggregates.
Key Takeaways
• GDP measures the value of final goods and services produced within a country’s borders.
• India estimates GDP using Production, Expenditure, and Income Methods.
• GDP measures Value Addition to avoid double counting.
• The Production Method measures output, the Expenditure Method measures spending, and the Income Method measures earnings.
• In practice, India uses a combination of all three methods for accurate GDP estimation.
GDP and GVA
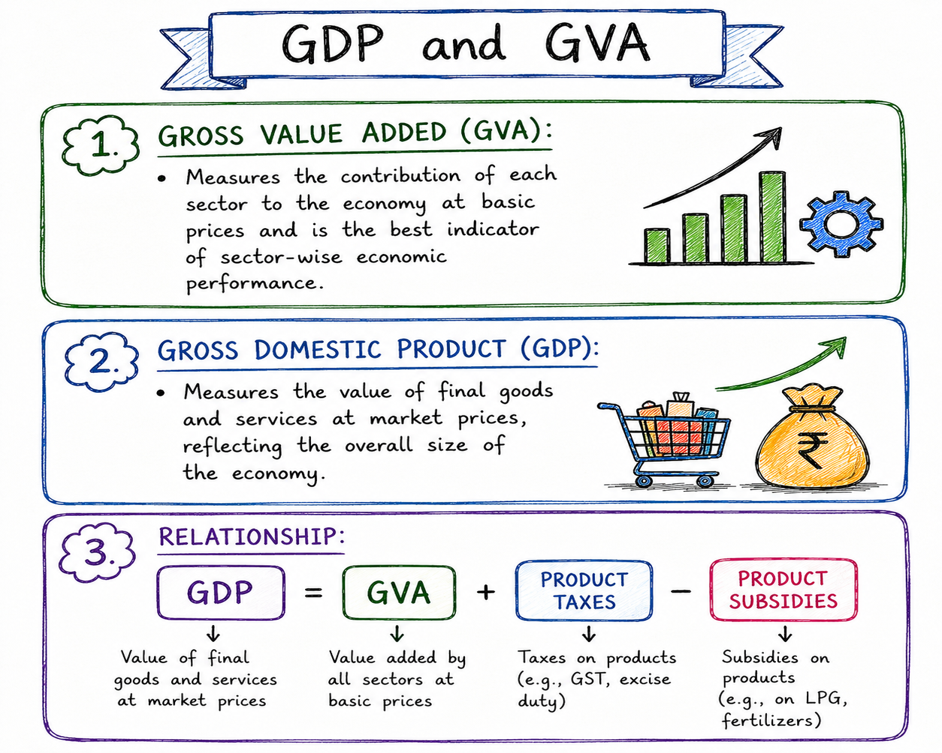
Gross Domestic Product (GDP) and Gross Value Added (GVA) are two closely related indicators used to measure economic activity. While both measure production, they differ in their approach.
GVA measures the value added by producers during the production process, whereas GDP measures the final value of goods and services produced in the economy after adjusting for taxes and subsidies on products.
In simple terms, GVA shows the contribution of producers, while GDP shows the overall size of the economy from the consumer’s perspective.
What is Gross Value Added (GVA)?
Gross Value Added (GVA) measures the additional value created by producers after deducting the cost of intermediate goods and services used in production.
Definition
Gross Value Added (GVA) is the value of output produced by an enterprise or sector minus the value of intermediate consumption used in the production process.
Formula
GVA = Value of Output − Intermediate Consumption
Example
Suppose a bakery sells bread worth ₹1,000 and uses flour, sugar, and other raw materials worth ₹600.
GVA = ₹1,000 − ₹600 = ₹400
Thus, the bakery contributes ₹400 to the economy.
Difference between GDP and GVA
| Basis | GDP | GVA |
| Meaning | Measures the total value of final goods and services produced in an economy. | Measures the value added by producers during production. |
| Perspective | Consumer’s perspective. | Producer’s perspective. |
| Includes Taxes and Subsidies | Yes | No |
| Formula | GDP = GVA + Product Taxes − Product Subsidies | GVA = Output − Intermediate Consumption |
| Purpose | Measures overall economic performance. | Measures sector-wise contribution to the economy. |
Relationship between GDP and GVA
GDP and GVA are closely linked because both measure the same economic activity from different perspectives.
Formula
GDP = GVA + Product Taxes − Product Subsidies
Where,
- Product Taxes: GST, Excise Duty, Customs Duty and other taxes on products.
- Product Subsidies: Subsidies provided by the government on specific goods and services.



Why is GVA Important?
• Measures Sectoral Performance: Helps assess the contribution of agriculture, industry, and services.
• Supports Policy Formulation: Enables policymakers to identify sectors requiring support.
• Reflects Production Trends: Indicates changes in output across different sectors.
• Better Supply-Side Indicator: Measures actual production before adjusting for taxes and subsidies.
Nominal GDP and Real GDP
GDP can be measured at current prices or constant prices, resulting in Nominal GDP and Real GDP.
The distinction is important because changes in GDP may result from either higher production or higher prices.
Nominal GDP
Nominal GDP measures the value of goods and services at current market prices.
It reflects changes arising from both production and inflation.
Features
• Current Prices: Uses prices prevailing during the year.
• Includes Inflation: Higher prices increase Nominal GDP even if production remains unchanged.
• Useful for Current Market Value: Reflects the present size of the economy.
Real GDP
Real GDP measures output at constant prices by removing the impact of inflation.
It reflects the actual increase in production, making it a better indicator of economic growth.
Features
• Constant Prices: Uses the prices of a selected base year.
• Excludes Inflation: Measures only changes in production.
• Better Growth Indicator: Preferred for comparing economic growth over time.
Difference between Nominal GDP and Real GDP
| Basis | Nominal GDP | Real GDP |
| Price | Current prices | Constant prices |
| Inflation | Includes inflation | Excludes inflation |
| Growth Measurement | May overstate growth during inflation | Reflects actual economic growth |
| Purpose | Measures current market value | Measures real increase in production |
GDP Deflator
The GDP Deflator measures the overall change in prices of all final goods and services produced in an economy. Unlike the Consumer Price Index (CPI), it covers the entire domestic production.
Formula
GDP Deflator = (Nominal GDP ÷ Real GDP) × 100
Importance of GDP Deflator
• Measures Economy-wide Inflation: Captures price changes across all sectors.
• Converts Nominal GDP into Real GDP: Removes the impact of inflation from GDP estimates.
• Supports Policy Decisions: Helps governments and central banks assess inflationary trends.
• Broad Coverage: Includes all domestically produced final goods and services.
National Income
National Income represents the total income earned by the residents of a country from all economic activities during a financial year.
Unlike GDP, which measures production within a country’s borders, National Income measures income earned by residents, irrespective of where it is generated.
Definition
National Income is the total income earned by the residents of a country from the production of goods and services during a given period.
National Income Aggregates
National Income is measured through different aggregates, each serving a specific purpose.
Gross Domestic Product (GDP)
• Measures the total value of final goods and services produced within the domestic territory of a country.
Gross National Product (GNP)
• Measures GDP plus Net Factor Income from Abroad (NFIA).
Formula
GNP = GDP + NFIA
Net Domestic Product (NDP)
• Measures GDP after deducting depreciation.
Formula
NDP = GDP − Depreciation
Net National Product (NNP)
• Measures GNP after deducting depreciation.
Formula
NNP = GNP − Depreciation
National Income (NNP at Factor Cost)
• Represents the total factor income earned by residents after adjusting for depreciation and indirect taxes.
Personal Income (PI)
• Measures the income actually received by individuals before payment of personal taxes.
Disposable Personal Income (DPI)
• Represents the income available with households after paying direct taxes.
Formula
DPI = Personal Income − Personal Taxes
Key Takeaways
• GVA measures the value added by producers, whereas GDP measures the value of final goods and services.
• GDP = GVA + Product Taxes − Product Subsidies.
• Nominal GDP includes inflation, whereas Real GDP measures actual production.
• GDP Deflator measures economy-wide inflation.
• National Income is measured through aggregates such as GDP, GNP, NDP, NNP, Personal Income, and Disposable Personal Income, each reflecting a different aspect of economic activity.
India’s GDP Performance
India has emerged as one of the world’s fastest-growing major economies, driven by strong domestic demand, infrastructure development, digital transformation, and policy reforms. The country’s growth has gradually shifted from an agriculture-based economy to one dominated by the services sector, while manufacturing continues to gain importance.
Although GDP has grown steadily over the years, sustaining high growth requires higher investment, quality employment, improved productivity, and inclusive development.
Key Drivers of India’s GDP
Several sectors contribute to India’s economic growth.
Private Consumption
Private Final Consumption Expenditure (PFCE) is the largest contributor to India’s GDP. Household spending on food, housing, healthcare, education, transport, and consumer goods drives domestic demand and supports economic activity.
Investment
Investment, measured through Gross Fixed Capital Formation (GFCF), plays a crucial role in expanding productive capacity. Public infrastructure projects and private sector investment contribute to long-term economic growth.
Government Expenditure
Government spending on infrastructure, defence, education, healthcare, and welfare programmes stimulates demand and supports economic development.
Net Exports
Exports contribute positively to GDP by generating foreign exchange and expanding markets for domestic industries. However, higher imports may reduce net export contribution.
Services Sector
The services sector is the largest contributor to India’s Gross Value Added (GVA). Information Technology (IT), banking, financial services, tourism, transport, trade, and communication have emerged as major growth drivers.
Manufacturing Sector
Government initiatives such as Make in India and the Production Linked Incentive (PLI) Scheme aim to strengthen manufacturing, increase exports, and generate employment.
Agriculture
Agriculture remains an important source of livelihood and contributes significantly to food security, rural employment, and overall economic stability.
Importance of GDP
GDP is the most widely used indicator of economic performance. It helps governments, businesses, investors, and international organisations evaluate the health of an economy and formulate policies.
Why is GDP Important?
• Measures Economic Growth: GDP indicates whether the economy is expanding or contracting.
• Supports Policy Formulation: Governments and the RBI use GDP data while designing fiscal and monetary policies.
• Guides Investment Decisions: Businesses and investors use GDP trends to assess economic opportunities.
• Enables International Comparison: GDP allows comparison of economic performance across countries.
• Assesses Sectoral Performance: GDP data helps identify the contribution of agriculture, industry, and services.
• Supports Budget Planning: Government revenue and expenditure decisions are influenced by GDP growth.
• Measures Living Standards: Per Capita GDP provides a broad indication of average income and living standards.
Limitations of GDP
Although GDP is the most widely used measure of economic performance, it does not capture every aspect of development and well-being.
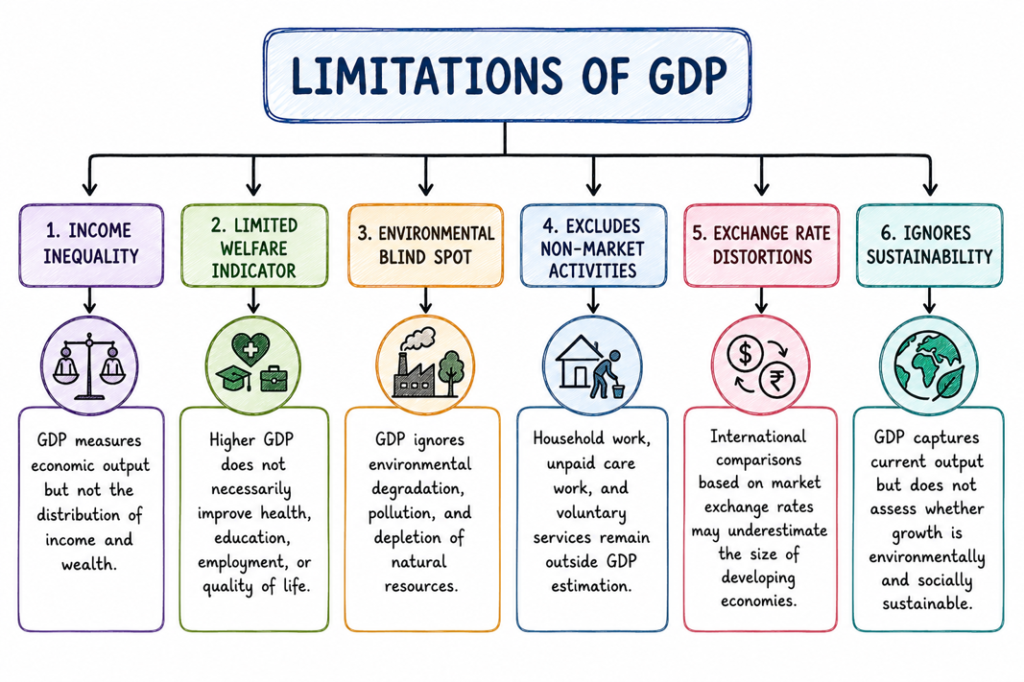
Major Limitations
• Ignores Income Inequality: GDP does not indicate how income is distributed among people.
• Excludes Unpaid Work: Household work, volunteer services, and caregiving are not included in GDP estimates.
• Does Not Measure Quality of Life: Higher GDP does not necessarily improve health, education, happiness, or social well-being.
• Ignores Environmental Costs: Economic activities that degrade natural resources may increase GDP without ensuring sustainable development.
• Limited Coverage of Informal Sector: Estimating production in the unorganised sector remains a challenge despite improvements in data collection.
• Does Not Reflect Wealth Distribution: GDP measures production, not ownership of assets or wealth.
• May Not Capture Digital Economy Fully: Rapidly evolving digital services and platform-based activities can be difficult to estimate accurately.
Alternative Indicators of Economic Performance
Since GDP has several limitations, economists use additional indicators to assess a country’s overall development and sustainability.
Purchasing Power Parity (PPP)
Purchasing Power Parity adjusts GDP for differences in price levels across countries, enabling more meaningful international comparisons of living standards.
Gross National Income (GNI)
GNI measures the total income earned by a country’s residents, including income received from abroad.
Formula
GNI = GDP + Net Factor Income from Abroad (NFIA)
Human Development Index (HDI)
HDI measures development based on three dimensions:
- Health
- Education
- Standard of Living
It provides a broader measure of development than GDP alone.
Green GDP
Green GDP adjusts conventional GDP by accounting for environmental degradation and depletion of natural resources. It provides a more sustainable measure of economic progress.
Inclusive Wealth Index (IWI)
The Inclusive Wealth Index measures a country’s long-term wealth by considering:
- Produced Capital
- Human Capital
- Natural Capital
It assesses whether economic growth is sustainable over time.
Which Indicator is Better?
No single indicator can fully measure a country’s progress.
- GDP measures production and economic growth.
- GNI measures income earned by residents.
- PPP enables international comparison.
- HDI measures human development.
- Green GDP captures environmental sustainability.
- IWI assesses long-term national wealth.
Therefore, policymakers use a combination of these indicators to obtain a comprehensive picture of economic performance and development.
Key Takeaways
• India’s GDP growth is driven by consumption, investment, government expenditure, and net exports.
• The services sector is the largest contributor to India’s economy, while manufacturing and infrastructure remain key priorities.
• GDP is the most widely used measure of economic performance but does not capture inequality, environmental sustainability, or overall well-being.
• Indicators such as PPP, GNI, HDI, Green GDP, and Inclusive Wealth Index complement GDP by providing a broader assessment of development.
Significance of Periodic Base Year Revision
The base year is the reference year used to calculate Real GDP at constant prices. As an economy evolves, production patterns, consumption behaviour, technology, and industrial structure change. Periodic revision of the base year ensures that GDP estimates accurately reflect these structural changes.
A revised base year improves the reliability of national income estimates and aligns India’s statistical system with international best practices.
Why is Base Year Revision Important?
• Reflects Structural Changes: Captures changes in the economy, including the growth of digital services, e-commerce, start-ups, and emerging industries.
• Improves Data Accuracy: Incorporates updated databases, enterprise surveys, and administrative records for more reliable GDP estimation.
• Aligns with Global Standards: Brings India’s National Accounts in line with the United Nations System of National Accounts (SNA 2008) and international statistical practices.
• Supports Better Policymaking: Provides accurate data for fiscal policy, monetary policy, investment planning, and macroeconomic forecasting.
• Improves International Comparisons: Enables meaningful comparison of India’s GDP with other economies using updated statistical standards.
Challenges in GDP Estimation
Estimating GDP for a large and diverse economy like India is a complex task. The presence of a large informal sector, rapid technological changes, and data limitations pose significant challenges.
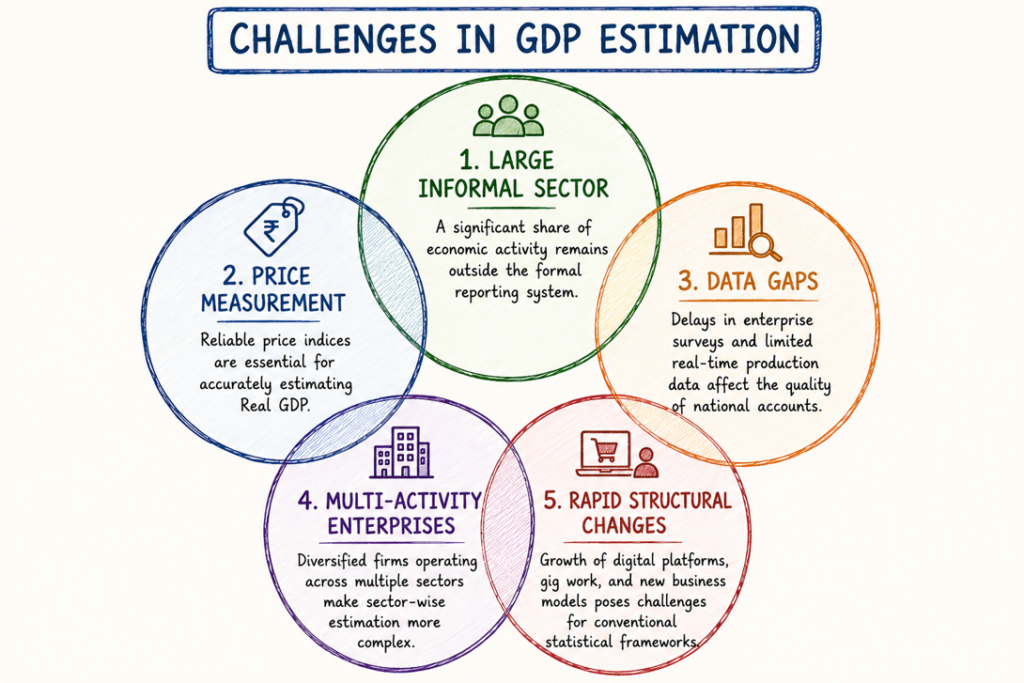
Major Challenges
• Large Informal Sector: A substantial share of India’s economic activity takes place in the unorganised sector, making accurate estimation difficult.
• Data Gaps: Delays in collecting reliable production, income, and expenditure data may affect the quality of GDP estimates.
• Rapidly Evolving Digital Economy: Digital platforms, online services, and gig economy activities are often difficult to measure accurately.
• Coverage of Small Enterprises: Many micro and small businesses maintain limited financial records, reducing data reliability.
• Price Measurement Issues: Inaccurate price indices can affect the estimation of Real GDP.
• Changing Economic Structure: Frequent changes in production patterns require regular updates to statistical methods and databases.
• Revisions in GDP Estimates: Initial GDP estimates are often revised as more comprehensive data become available.
Way Forward
Improving GDP estimation requires stronger statistical systems, wider use of technology, and regular methodological updates.
Key Measures
• Adopt Double Deflation: Improve Real GVA estimation by separately adjusting output prices and input costs.
• Strengthen Price Indices: Develop a comprehensive Producer Price Index (PPI) covering both goods and services.
• Leverage Digital Databases: Integrate GSTN, MCA21, e-Invoicing, ASUSE, PLFS, and other administrative databases for timely and reliable estimates.
• Improve Informal Sector Coverage: Expand enterprise surveys and strengthen data collection for unorganised economic activities.
• Revise Base Year Periodically: Update the base year regularly to reflect structural changes in the economy.
• Strengthen Statistical Capacity: Invest in technology, skilled manpower, and institutional coordination to improve the quality of national accounts.
Conclusion
GDP is the most widely used indicator of economic performance as it measures the size and growth of an economy. However, it does not capture income inequality, environmental sustainability, or overall human well-being.
Therefore, GDP should be complemented with indicators such as Gross National Income (GNI), Human Development Index (HDI), Green GDP, and the Inclusive Wealth Index (IWI) to obtain a more comprehensive assessment of economic progress. Strengthening statistical systems and improving data quality will further enhance the accuracy of GDP estimates and support evidence-based policymaking.
Frequently Asked Questions (FAQs)
1. What is GDP?
GDP (Gross Domestic Product) is the total market value of all final goods and services produced within a country’s geographical boundaries during a specific period.
2. Who calculates GDP in India?
GDP and National Income estimates are prepared by the Ministry of Statistics and Programme Implementation (MoSPI).
3. What is the difference between GDP and GVA?
GDP measures the total value of final goods and services produced in an economy, while GVA measures the value added by producers before adjusting for taxes and subsidies.
4. What is the formula for GDP?
Using the expenditure approach:
GDP = C + I + G + (X − M)
Where C = Consumption, I = Investment, G = Government Expenditure, X = Exports, and M = Imports.
5. What is the difference between Nominal GDP and Real GDP?
Nominal GDP is calculated at current prices, whereas Real GDP is calculated at constant prices after removing the impact of inflation.
6. Why is GDP important?
GDP helps measure economic growth, compare economies, formulate fiscal and monetary policies, and assess the overall performance of an economy.
7. What are the limitations of GDP?
GDP does not measure income inequality, environmental degradation, unpaid work, or overall quality of life.
8. What is the base year in GDP?
The base year is the reference year used to calculate Real GDP at constant prices and measure actual economic growth.
UPSC Previous Year Questions (PYQs)
Q1. How are the GDP of a country and the quality of life of its people related? Is the growth of GDP sufficient to ensure the improvement in the quality of life? (UPSC GS Paper III, 2020)
Practice Questions
Prelims Practice Question
Q. Which of the following statements regarding Gross Domestic Product (GDP) is/are correct?
- GDP measures the value of all final goods and services produced within a country’s geographical boundaries.
- Real GDP is calculated using current market prices.
- GDP Deflator measures economy-wide inflation.
Select the correct answer using the code below:
(a) 1 and 2 only
(b) 1 and 3 only
(c) 2 and 3 only
(d) 1, 2 and 3
Answer: (b)
Practice Questions
1. GDP is the most widely used indicator of economic performance, yet it has important limitations. Critically examine. (15 Marks, 250 Words)
2. Discuss the significance of Gross Value Added (GVA) and explain how it differs from Gross Domestic Product (GDP). (10 Marks, 150 Words)


 Ravi Raaz
 Hassan Khan
 Shadab Ali