
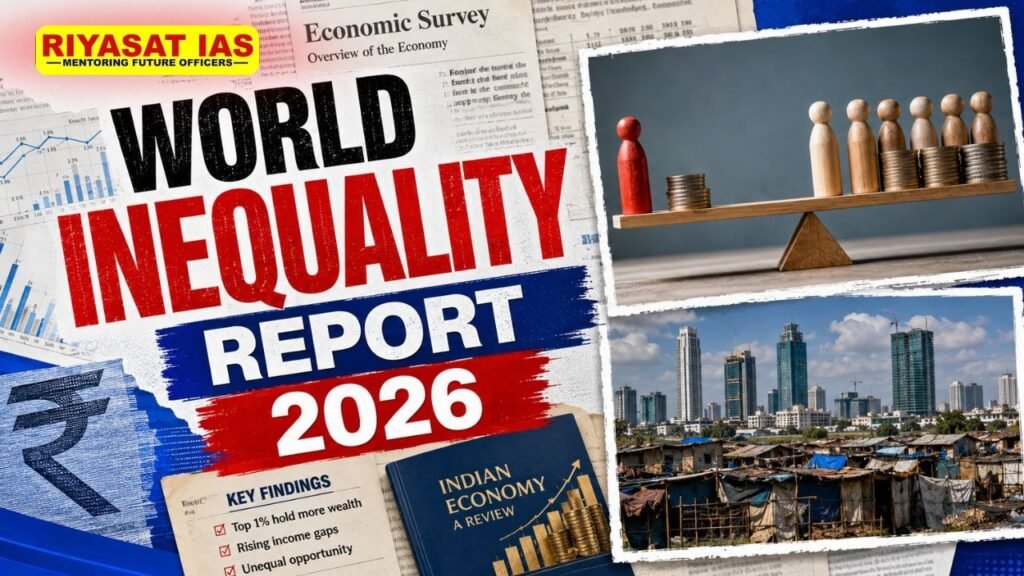
Economic growth does not always benefit everyone equally. Over the past few decades, global wealth has increased substantially, but access to assets, income and essential public services remains highly unequal. These differences are visible not only between countries but also within individual economies and across gender groups.
The World Inequality Report 2026, the third edition of the report, examines these disparities through data on income, wealth, labour income, gender inequality, climate responsibility and international capital flows. Its findings highlight the continued concentration of wealth among a small section of the global population, with significant inequalities also visible in countries such as India.
Global and Regional Findings
The report highlights several major patterns in the distribution of wealth, income and economic opportunities.
Global Wealth Distribution: The richest 10% of the global population owns 75% of total wealth, while the bottom 50% owns only 2%. The top 1% alone holds around 37% of global wealth.
Gender Gap in Labour Income: Women receive only 26% of global labour income, a share that has remained broadly unchanged since 1990. The gap becomes wider when unpaid domestic and care work is taken into account.
Regional Gender Differences: Women’s share of labour income varies considerably across regions. It is around 16% in the Middle East and North Africa, 20% in South and Southeast Asia, 28% in Sub-Saharan Africa, 34% in East Asia and about 40% in Europe, North America and Oceania.
Climate Responsibility: The distribution of emissions is also highly unequal. According to the report, the poorest 50% accounts for only 3% of carbon emissions linked to private capital, while the richest 10% accounts for 77%. The top 1% alone contributes around 41%.
India’s Inequality: India shows a particularly wide gap between the top and bottom sections of the population. The top 10% receives 58% of national income, while the bottom 50% receives 15%. Wealth is even more concentrated: the top 10% owns 65% of total wealth, the top 1% owns 40%, while the bottom 50% owns less than 6%. Women account for only 18% of total labour income.
Why Does Economic Inequality Matter?
Inequality is not only a question of differences in income and wealth. Persistent economic gaps can also influence opportunities, public finances, social mobility and access to basic services.



Economic Mobility: When wealth and assets are concentrated, lower-income households may find it harder to pay for education, acquire skills or invest in businesses.
Public Revenue: Limited taxation of wealth and capital can reduce the government’s revenue base, affecting its ability to finance healthcare, education and other public services.
Climate Impact: Since higher-income groups account for a large share of emissions associated with private capital, climate policies also need to consider differences in consumption and wealth.
Gender Equality: Reducing wage gaps and recognising unpaid care work can improve women’s participation in the formal economy and strengthen their financial independence.
Key Drivers and Challenges
Changing Global Income Patterns: Since 1980, the global distribution of income has changed significantly. China’s economic expansion moved large sections of its population into middle- and upper-middle-income groups. India’s relative position, however, has been less favourable, with a large share of its population remaining in the lower half of the global income distribution.
Taxation: Differences in how labour income and capital income are taxed can contribute to unequal outcomes. The report highlights the issue of high-wealth individuals facing relatively lower effective tax rates in some circumstances.
Limited Public Investment: When tax revenues are insufficient, governments may have less capacity to provide universal healthcare, quality education and infrastructure.
Unpaid Care Work: Women continue to perform a large share of unpaid domestic and care work. The limited recognition and support for this work contributes to persistent gender inequalities in income and economic participation.
Policy Measures to Reduce Inequality
Progressive Taxation: Tax systems can be designed so that higher-income individuals and owners of substantial capital contribute a proportionate share of their income and wealth.
Investment in Public Services: Greater investment in healthcare, education, childcare and nutrition can improve access to essential services and create opportunities for lower-income households.
Stronger Social Protection: Cash transfers, pensions and unemployment support can provide greater income security for vulnerable sections of society.
Gender-Sensitive Policies: Affordable childcare, recognition of unpaid care work and measures to reduce wage gaps can support greater participation of women in the formal workforce.
Climate Policy: Climate measures should take differences in income, wealth and consumption into account so that the burden of environmental policies does not fall disproportionately on low-income households.
Conclusion
The World Inequality Report 2026 highlights that economic inequality remains a major global concern. Wealth and income continue to be concentrated among a relatively small section of the population, while gender gaps and differences in climate responsibility add further dimensions to the problem.
For India, reducing inequality requires more than redistribution alone. Progressive taxation, better public services, stronger social protection, greater employment opportunities and investment in human capital can help broaden access to economic opportunities.
The broader objective should be to ensure that economic growth translates into wider access to income, assets, public services and opportunities, rather than being concentrated among a limited section of society.
Frequently Asked Questions (FAQs)
What is the World Inequality Report 2026?
It is the third edition of a report examining global inequalities in income, wealth, gender, labour income and climate responsibility.
How much global wealth is owned by the top 1%?
According to the provided report figures, the richest 1% owns around 37% of global wealth.
What is the level of inequality in India?
The top 10% receives 58% of national income and owns 65% of total wealth, while the bottom 50% receives 15% of income and owns less than 6% of wealth.
What is the global gender gap in labour income?
Women receive around 26% of global labour income, according to the report.
How can inequality be reduced?
Key measures include progressive taxation, stronger public services, social protection, gender-focused policies and investment in human capital.


 Ravi Raaz
 Hassan Khan
 Shadab Ali